
Point Out the Delinquent: What the First Org Chart Was Drawn to Do
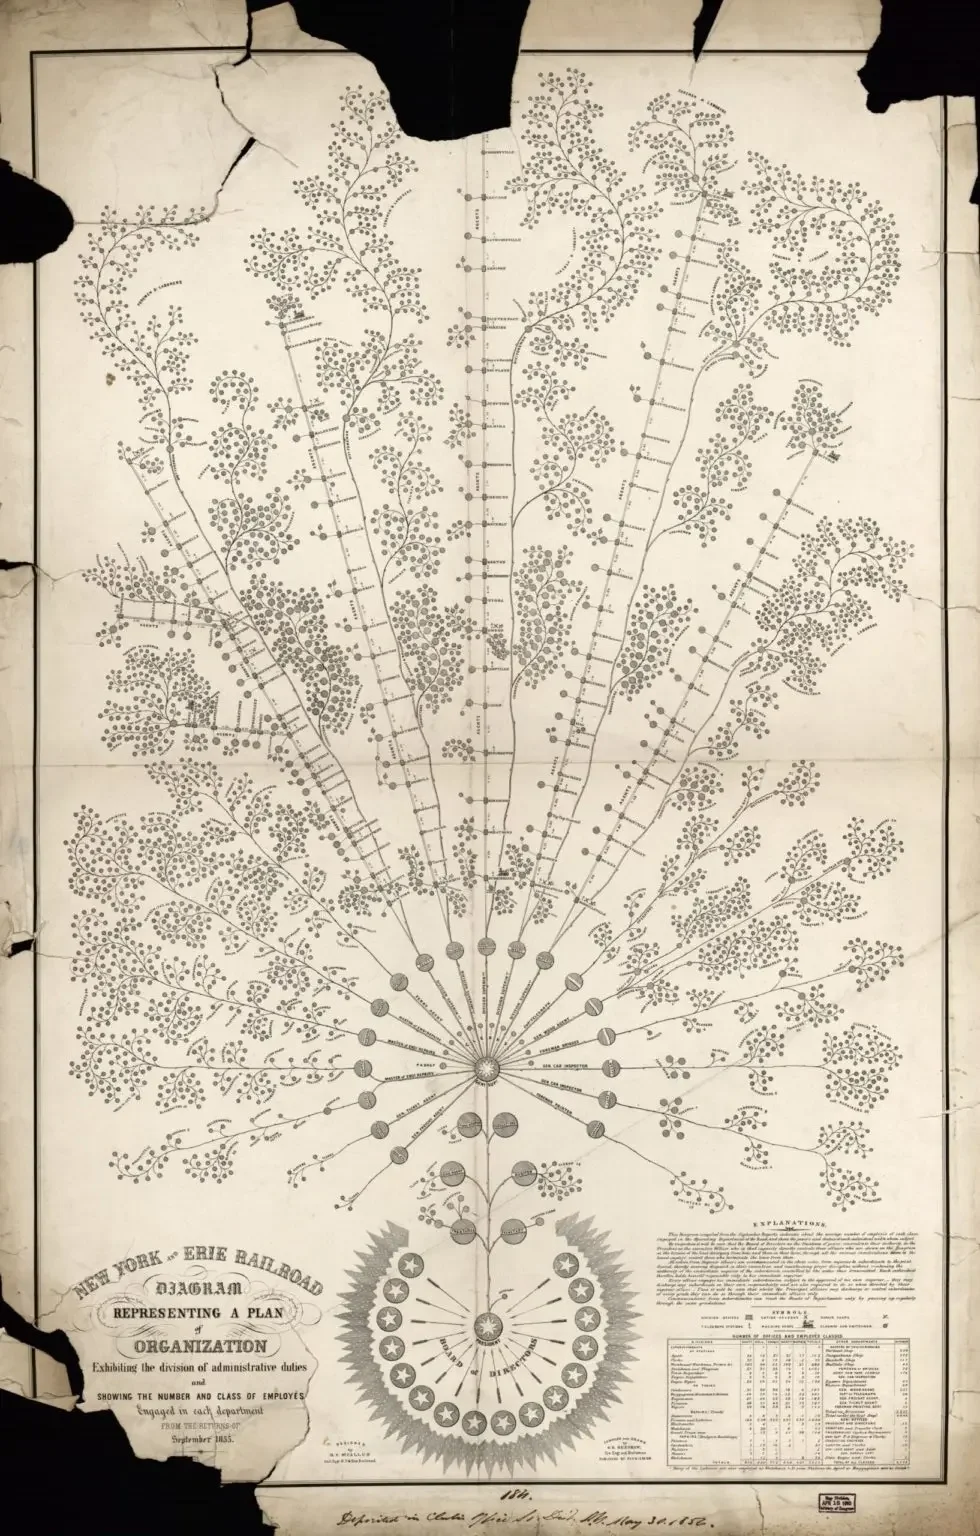
New York and Erie Railroad diagram representing a plan of organization : exhibiting the division of academic duties and showing the number and class of employés engaged in each department. Map by D.C. McCallum and G.H. Henshaw, 1855. Geography and Map Division.
The first org chart in American business was drawn so one man could find out who to blame, and find out fast.
Who invented the org chart?
In 1855, Daniel McCallum became general superintendent of the New York and Erie Railroad: 500 miles of track, 5 operating divisions, more than 5,000 employees. McCallum had left school to become a carpenter. He built bridges for the Erie, then ran a division, then ran the whole road. He knew something his stockholders didn't want to hear: the railroad was losing money because nobody could see it.
His 1856 report to the stockholders explained the problem plainly. A superintendent of a 50-mile road could know every person on the line by name and handle every question himself. A 500-mile road broke that. Personal familiarity was the whole management system, and the system had a range of about 50 miles.
So McCallum built a replacement. Six principles, written down. Division of responsibilities. Real authority to match them. Hourly and daily reports moving by telegraph. And the sixth principle, stated without apology: a system that would not only detect errors immediately but point out the delinquent.
Then he had it drawn. A civil engineer named George Holt Henshaw compiled the returns of September 1855 into a diagram shaped like a tree, every branch a division, every leaf a crew, every line a reporting relationship. The chart itself spelled out the rule: each individual holds himself responsible only to his immediate superior. Henry Varnum Poor lithographed it and sold copies for a dollar apiece. British railway experts described it in a parliamentary report. The corporation as you know it was learning to see itself, and the picture it learned from was a blame map.
The job: Division Superintendent. The cost: 1855.
Stand inside one of those five boxes for a moment. A division superintendent under McCallum ran roughly a hundred miles of single-track railroad. His tools were a telegraph key, a watch, and a book of rules. His trains reported their positions hourly. His derelictions of duty moved up the wire with great promptness, because the system was designed to move them with great promptness. He had authority to dismiss the men below him and a duty to answer for them, and he answered to exactly one person. McCallum ran the road with strict precision and stern discipline, and the division superintendent lived where that discipline concentrated: watched from above, resented from below, personally accountable for everything between.
And here is the part the diagram never showed. McCallum got the general superintendent job by succeeding Charles Minot. When McCallum resigned, Minot took the job back. The two men traded the same authority inside the same company, with the same people watching. The authority at the top of the first org chart changed hands twice between two men who knew each other. The drawing recorded the new reporting lines. It recorded nothing about what it cost the two of them to work inside them.
What does the org chart still do today?
That is the inheritance. The org chart survived the railroads, survived the factory, survived the cubicle, and your company still runs on it: a picture of authority with no line for anything else. It gets redrawn now more than ever. Flattening removes layers, promotions fill from within, and every redraw moves decision rights between people who already have history. The diagram takes the change in an afternoon. The people carry it for years.
Leadership Cartography reads the org chart as what it has always been: an accountability instrument, built to route responsibility and blame through people who would never meet. The relationship between two boxes has never appeared on it, and it still doesn't. When your peer becomes your boss, or your friend becomes your direct report, you are living in the oldest blind spot in American management. The Former Peer Transition Map covers the terrain McCallum's drawing never could.
If the org chart was invented to point out the delinquent among 5,000 strangers, why do we keep expecting it to manage the relationships between people who know each other?
Where does this land for you?
If the system you have been managing inside is starting to feel more familiar than you would like, the Leadership Map Source Assessment can help you name what you are working with. Identify Your Legacy

Related Reading
How to Lead Someone Who Used to Be Your Equal: This week's Compass article walks the terrain the org chart can't see: leading someone who used to stand beside you.
The Org Chart Moves. Relationships Remember. The Manager's Mind on why relational work is the infrastructure the diagram never measured.
Sources
McCallum, D. C. (1856). Report of the Superintendent of the New York and Erie Railroad to the Stockholders, for the Year Ending September 30. New York and Erie Railroad Company.
Chandler, A. D. Jr. (1977). The Visible Hand: The Managerial Revolution in American Business. Harvard University Press.
Vose, G. L. (1857). Handbook of Railroad Construction. J. Munroe.
Library of Congress. New York and Erie Railroad diagram representing a plan of organization, from the returns of September 1855. Item 2017586274.
Rosenthal, C. (2013). Big Data in the Age of the Telegraph. McKinsey Quarterly.
Pfeiffer, D. A. (2011). Working Magic with Cornstalks and Beanpoles: Records Relating to the U.S. Military Railroads During the Civil War. Prologue, Vol. 43, No. 2.
Wrege, C. D., & Sorbo, G. Jr. (2005). A Bridge Builder Changes a Railroad: The Story of Daniel Craig McCallum. Canal History and Technology Proceedings 24.